Written by @AlbionAnalytics
Albion’s average number of passes has spiked from 378 per game last season to 492 per game this season, with average passes per possession naturally following suit: up to 4.85 from 3.69 (Wyscout). In Tifo Football’s video breaking down Potter’s tactics, they highlight numbers which fully support this idea that Brighton are ‘keeping the ball more, passing more’. So well is this reflected in the numbers in-fact, that our averages for ball possession, passes per game, final third passes per game, progressive passes per game and deep completions per game have all increased from last season. Perhaps our change in passing approach is best demonstrated by the decrease in our long ball average per game, despite having much more possession.
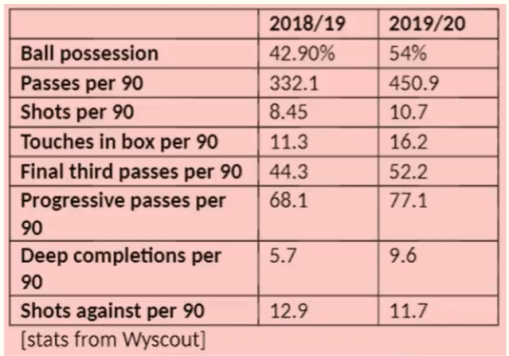
Newcastle away is the exemplar fixture for demonstrating the stark contrast in passing approach, with the graphic below showing our performance in multiple passing based metrics from last season (18/19) and this season (19/20):
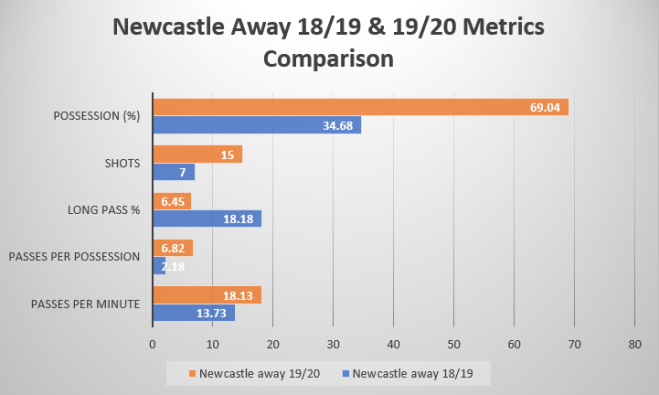
Taking this Wyscout data from the two fixtures, visually the differences in Brighton’s approach are obvious. Last season we set up pragmatically, ceding control of the ball to hit Newcastle on the counter-attack; this season we did the converse: attempted over 680 passes – completing over 620 – and dominating with almost 70% possession, figures which were over double what we recorded in the same fixture last season. Nevertheless, the critical difference between the two fixtures was the score-line: we drew 0-0 this season and last season our pragmatic approach proved more fruitful, as we ran out 1-0 winners on Tyneside.
This article’s central focus is to draw attention to how and why our goals this season don’t reflect such a change in passing approach. In Chris Anderson and David Sully’s book The Numbers Game, they focus on a statistically supported argument that the majority of goals occur from sequences involving very few passes – just 2 of every 9 goals scored are from passing moves with 4+ passes. Anderson and Sully’s observation that two-thirds of goals are scored from open play is mirrored perfectly by our goalscoring – up to and including game-week 12: 10 of our 15 goals thus far have been from open play.
The visual below shows the number of passes involved in each of the 10 open-play ‘possessions’ we have had in the Premier League this season which have led to a goal:
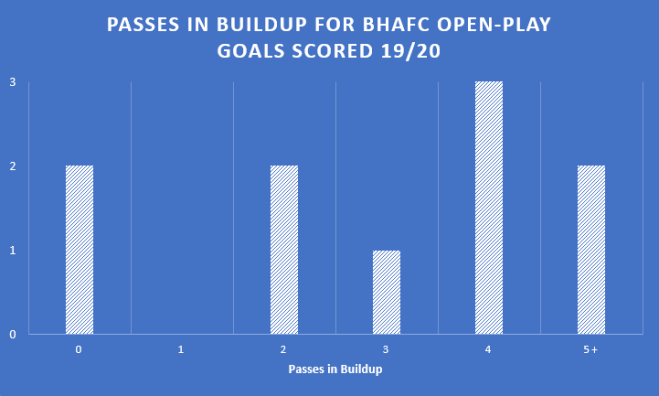
8 out of 10 of our open play goals came from build-ups of 4 or fewer passes; surprisingly, given the averages mentioned for passes per possession, just 2 of our 10 open play goals were from moves with 5+ passes in the build-up.
Naturally, set-piece goals will skew the distribution towards fewer passes, as goals can be scored or assisted directly from these scenarios, often resulting in goals scored with 0 or just 1 pass from them. From the 5 set-piece situations we’ve scored from, 3 involved 1 pass (Webster vs Villa; Duffy vs Norwich; Dunk vs Man United) and 2 were direct finishes – 0 passes – (Gross vs Everton; Maupay vs Everton).
In order to maximise the sample size, the own goals from Doucoure (Watford) and Digne (Everton) have been treated as if they were finishes by a Brighton player – stats providers often consider own goals to not be assist-able as the passes are technically incomplete, thus any passes in the build-up to it are additionally excluded. In this case though, the finish itself is irrelevant as it is the build-up play which is of interest, hence their inclusion.
Despite us averaging over 4 passes per possession across Premier League games this season, our average passes per possession for open play goals is only 3.5, around 1 pass per possession fewer than what we are averaging each game.
Referring to the aforementioned Newcastle fixture, we averaged 6.82 passes per possession in that game – a season high. That average is almost double the number of passes we typically make in possessions we score from in open play! Compared to our opening 12 games last season, we’re averaging more passes per possession:
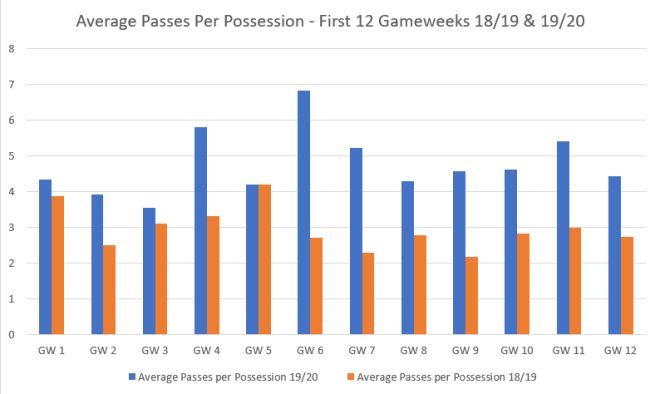
On just 2 occasions this season – gameweek 2 (by 0.08) and gameweek 3 (played most of the game with 10 men) – have we averaged less than 4 passes per possession. In comparison, last season we averaged less than 4 in 11 of the opening 12 gameweeks. In fact, whilst winning 3 on the bounce in October 2018, we recorded 2.77, 2.18 and 2.83 passes per possession respectively.
With such clear differentiation in passing approaches, crucially the amount of passes we’re making each time we have possession, you’d naturally expect our goals to mirror this, right? Wrong. Just 2 of our goals have had over 4 passes in their sequence, despite our average being above this for each possession. 7 passes in the build-up for Digne’s own goal and 9 passes for Maupay’s goal at Watford are the two outliers as actual ‘Potterball’ goals.
The more passes made in a sequence not only means more opportunity for breakdown to occur – as every pass needs to be accurate – but also may give the opportunity for the opposition to structure themselves better defensively, making them harder to breakdown. In addition, as pass frequency increases the average pass distance is expected to decrease – a higher passing tempo is typically met by a shorter passing approach. Shorter, more intricate passes are used to break down teams by playing through a press, rather than playing around it or over it with a long ball. Our lone example of this approach resulting in a goal is Digne’s own goal, and the defensive structure of Everton was to a large extent compromised, given we actually counter-attacked them, albeit from our own penalty area.
What is crucial to understand is that as we are purely looking at goals, excluding own goals, all passing moves have been successful ones. Therefore, long passes which are successful are significantly more likely – overall – to generate goals than shorter passes, as they are covering a longer distance and therefore placing you closer to the opposition’s goal. There’s a system used to determine the value of a pass in relation to what extent it creates a goalscoring opportunity – PassScore. Whilst this article won’t go into detail in applying this to our passing moves, there’s an excellent article explaining the role of the metric.
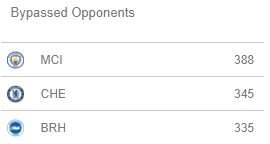
The ‘Packing’ metric can be applied in this scenario: this looks at the value of a pass based on how many opposition players it bypasses – to what extent the pass is ‘line-breaking’. Data from Impect on the 15th October had us 3rd in the league for ‘bypassed opponents’, with a total of 335, which only Chelsea and Man City had bettered; yes, up to that point we’d bypassed more opponents than Liverpool – albeit by one. Make of that what you will.
Dunk’s 2 assists this season have both been long passes; 8 opponents were bypassed with his assist for Maupay at Watford and all 10 Spurs opponents were bypassed in assisting Aaron Connolly for his second. When you consider that so many opponents can be bypassed with a single pass, which creates dangerous goalscoring opportunities, it is perhaps no surprise to see fewer passing moves make up most of the goals. Even with the 9-pass move that led to Maupay’s debut goal, 8 of the 9 passes occurred in our defensive third, as we switched play from right to left, and the last of the 9 passes was of course that long pass from Dunk which bypassed 8 opponents.
Of course making four or more consecutive passes doesn’t eliminate the chance of you scoring altogether, though typically the more passes you make decreases the likelihood of scoring. If you like, passes per possession and goalscoring likelihood almost appear negatively correlated. Therefore, this surely means ‘Potterball’ is ultimately purposeless? Not at all. Maupay’s goal at Watford may be a perfect example of how high passing sequences may lead to goals in manners that aren’t expected. Most would consider a high passing move leading to a goal to manifest as a Barcelona or Spain ‘tiki-taka’ move overflowing with 1-touch passing and flicks. However, at Watford we were able to use a short passing approach to shift the Watford press, to create central space for Dunk to break the forward line by carrying the ball, then break the midfield and defensive lines to find Maupay for his first of 4 goals this season.
Ultimately, not all goals require the same – or a lot of – passes to score; take the Doucoure own goal at Watford. Dale Stephens intercepted the ball on the halfway line, meaning when we countered, we only had half the pitch to cover; therefore fewer passes are required than if the sequence’s point of origin was from our own penalty area, as the distance between us and the opposition’s goal is shorter. In fact, only 4 of the 10 open play goals we’ve scored have involved Ryan and started from our own box: Maupay vs Watford, Maupay vs Burnley, Connolly (2nd goal) vs Spurs, Digne OG vs Everton. The fact that the majority of open play goals have started in the opposition half may be reflective of our increased pressing rate – another key ‘Potterball’ component – as the number of passes Brighton are allowing opponents before a defensive action occurs (PPDA) has dropped from 13.82 to 11.11 (Wyscout).
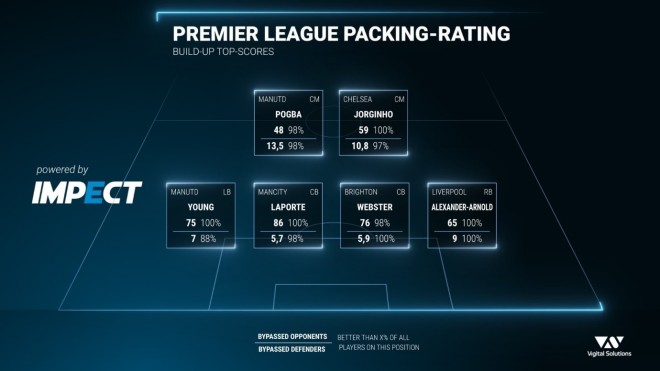
The most interesting statistic about these 4 goals? Half of them had 4 or fewer passes in the build-up. Accompanying the aforementioned long ball is the role of the ball carrying CB in reducing passes per possession leading to a goal – particularly Adam Webster. He carried the ball for approximately 50 yards for Maupay’s goal against Burnley, with progressive centre-backs a key cog in the ‘Potterball’ wheel. This shows that not all low passing moves mean long balls, there will be occasions where ground is covered by players running with the ball. Webster is particularly outstanding from a ‘Packing’ perspective: As of the 16th October he had bypassed 76 opponents with the ball, only Aymeric Laporte of City had more with 86.
It is difficult to draw concrete conclusions though, as ultimately the season is only 12 games old. There is a possibility that we have simply failed to convert many high passing moves and it may be that we will see the average rise in the remaining 26 games but up to now the occasional directness in Albion’s play has been effective.