Newcastle United – Season Review 20/21

Written by JP Quinn

In Steve Bruce’s first season in charge, most were in agreement that we rode our luck somewhat to finish in a fairly comfortable 13th place. Performances throughout the season were poor, although there were some signs towards the end of the season that the manager had found a better balance to the team. After the arrivals of Wilson, Fraser, Lewis and Hendrick in the summer, with no significant outgoings, no one could argue that the squad wasn’t stronger than last season. With that in mind, we would hope to see some improvement.

Firstly, there is a remarkable consistency in our points totals over the last 4 years. We both scored and conceded more goals than in any of the previous 3 seasons, though this isn’t really reflected in the expected numbers. One contributing factor is that we did see more penalties, having been awarded 7 this season after only getting 5 in the last 3 seasons combined. However, there was an overall improvement in the metrics compared to last season, more in line with the solid numbers we saw under Rafa but by no means outstanding.

The defensive numbers look much more stable this season and while the attack was still mostly poor, the strong finish to the season in terms of results is also evident here. The turning point seemed to be the 1-0 defeat at Sheffield United – after 6 games without a win and losing to the bottom team, Steve Bruce declared that ‘the gloves were off’ and he would be doing it his way from now on, indicating a switch to a more positive approach. We lost the next 3 games too, but after that we did see a change.

In came Graeme Jones as an assistant coach – a move completely out of the blue – seemingly to help transition to a more front-foot style of play. He had an immediate impact as we straight away switched to an unusual diamond shape with Fraser and Wilson as split strikers, which resulted in a 2-0 win at Everton and a convincing performance to go with it.

The team were certainly playing more on the front foot, pressing higher and looking more threatening, although results were mixed and there were some issues with the shape, most evident when unable to cope with Chelsea’s wing-back system. A 3-0 defeat to Brighton, leaving us in a precarious situation in the table, was the last straw for Bruce. He switched back to a 5-3-2 in the following game against Tottenham. In the 9 remaining games we took 17 points and scored 18 goals, sticking with that shape until the end of the season.

The xG FOR per game in the first half of the season was a dismal 0.69. In the second half it was 1.17. The turnaround in results was not a fluke this time – Bruce and his staff do deserve credit for that. However, you have to wonder what they were doing previously. Why did we spend 18 months playing so negatively, only to completely change approach mid-season? What was the long-term vision for this team (as if there were one)? In truth we’ve seen Bruce regularly flip-flop between tactics and players – it feels like a process of trial and error rather than any real plan.

We could view this season more generously in terms of the disruption caused by injuries and Covid, but even if we were to see the strong finish as a sign that Bruce can take the team forward next season, I think there is cause for concern in regard to the general lack of direction. I also worry about how this impacts the younger players in the squad – Jamal Lewis a glaring example of a player who needs some guidance, while the progress of the Longstaff brothers has stalled.

On top of that, every interview he gives seems to irk fans one way or another – either a tiresome cliché telling us they’re going to ‘roll wor sleeves up’ or a jibe about how, despite all the criticism, he’s performing just as well as the ‘mighty Rafa’. He doesn’t help himself.

The common trope about Newcastle fans is that our expectations are too high – we demand Champions League football! In reality, our expectations could hardly be lower. During Mike Ashley’s 14-year ownership we’ve only finished higher than 10th once, we’ve had 2 relegations and 1 season of European football. We do however think we can do better than just surviving in the Premier League year after year, and this is a problem for Bruce. The comparisons between Benítez and Bruce have been unavoidable but one of the biggest differences is that while Rafa always demanded more from the club and spoke about the potential, Bruce seems content to just keep his head above water while pointing out our limitations. His relationship with the fans now seems irreconcilable.

Obviously, there are bigger issues with the football club as a whole. Joe Willock being one of the bright sparks of the season, despite not actually being our player and no guarantee of him extending his stay on Tyneside, yet another symbol of the cub simply existing from season to season under the current ownership. But the fact is, Steve Bruce represents what the club has become under Mike Ashley. Doing the bare minimum to survive, with no real long-term plans or ambitions.

Data from Statsbomb and FBREF

Newcastle United Season Preview 2020/21

Written by JP Quinn – @AttackingCB

Last Season

A 13th place finish last season was seen as a relative success after a turbulent summer. Rafa Benítez left the club at the end of his contract and was replaced by Steve Bruce, Rondón’s loan was not made permanent and Ayoze Pérez was sold to Leicester City. The club broke their transfer record to bring Joelinton in for £40m but after 1 win in the opening 7 games, many feared the worst. Much of the season was spent very much in a relegation battle but Newcastle were able to keep their heads above water and eventually pulled away from the stragglers at the bottom of the league. After the enforced break in the season, 2 wins and 2 draws ensured Premier League safety but was followed by just 1 point in the last 5 games.

The final points total of 44 was in line with the previous 2 seasons, but in every other area the team appears to have got worse:

Scoring just 1 goal per game, there was an obvious issue in attack but what went slightly under the radar was the fairly solid defence, which had been the basis of Rafa’s reign, starting to leak more chances.

In the first half of the season we saw the attack get worse and the defensive numbers rise alarmingly – the team was consistently giving up far more chances than it was creating. But in the latter part of the season we saw an improvement at both ends, particularly the defensive side, which coincided (perhaps counter-intuitively) with a change in system from a back 5 to a back 4. I have previously written about how Newcastle were by far the least pressing team in the league under Bruce and this passive style seems to invite pressure, while the more positive approach allowed them to actually control the game a bit more.

The break in the season may have also had an impact, although the positive changes began just before lockdown. It also somewhat continues the trend from previous seasons under Rafa to finish the season strongly. I believe the team were fortunate not to be in more trouble for much of the season, when they were able to pick up points despite poor performances, but there were signs that Bruce had found a more balanced set-up by the end. A peak of 1 xG per game is hardly something to get too excited about though – the attack actually ranked 98th out of 98 across the big 5 leagues.

Jonjo Shelvey finished the season as the club’s top scorer, with 6 league goals, while record signing Joelinton managed just 2 despite featuring in every game. Dwight Gayle proved to be more of a threat in his limited game time, with Andy Carroll offering something from the bench when fit enough, but no one was reliably scoring or creating chances.

Transfers

This summer we’ve had to endure more drama, with the ongoing saga of a proposed takeover, involving a human rights abusing state and a power struggle with another human rights abusing state. Combine that with a pandemic (the club apparently regarding the scouting team as an unnecessary expenditure) and the transfer window looked like it might have been forgotten about. But not to worry, with Steve Bruce leading the recruitment, the club has actually done some significant business.

The biggest issue going forward was with Joelinton, brought in for big money and given the number 9 shirt, seemingly expected to carry the goal burden. But this was a young player, in a new country, playing a different role than he was accustomed to, in a team that doesn’t create many chances. Though you still expect more.

His numbers show that he simply wasn’t getting enough opportunities to score, with 4.8 expected goals across the whole season and an xG per shot of 0.09 compared to Gayle’s 0.2. The team looked better with Gayle, a natural poacher, willing to run in behind and sniff out chances in the box. He suffered a long-term injury in pre-season but in Callum Wilson the club have signed a player in a similar mold – 0.18 xG per shot – and someone who should be capable of getting double figures.

Wilson’s former Bournemouth teammate Ryan Fraser has also joined on a free transfer. 7 goals and 14 assists in 18/19 had top teams interested but the move didn’t materialise and last season he wasn’t so impressive. However, he has admitted to being less than 100% focused, was part of a struggling team and still showed signs that he can be a creative force.

Vis by @Edit_Kev

After loaning 2 left-backs last season, Jamal Lewis has joined from Norwich City to hopefully solve that problem position. At 22, he’s a player who may need some time but he has potential and Dummett still offers a reliable option there.

Jeff Hendrick has also joined on a free from Burnley and adds depth to the squad, although it remains to be seen where that leaves the Longstaff brothers and potentially Dan Barlaser in the pecking order, with a number of midfield options now.

The main concern now would probably be the lack of depth of real quality but it should be noted that there are simply too many players in the squad already. The club has been trying to shift the likes of Lazaar, Saivet, Murphy and Aarons for several years now but they remain on the books. The team could do with an improvement at right-back but has 3 already – as ever, the lack of real planning is evident.

Line-Up

Bruce stuck with an extremely negative 5 at the back for most of last season, claiming that the team wasn’t capable of playing any other way, but performances improved when he switched to a more positive 4-2-3-1 and you would expect him to favour something similar this season, given the signings made.

That front 4 starts to look like a more dangerous proposition, with plenty of pace and ability, though there may be some doubts about whether the defence is individually good enough to cope with a more expansive set-up, giving freedom to the likes of Saint-Maximin. The question remains too about where Joelinton fits into this, with the club surely not prepared to write off such a costly asset just yet.

The biggest question mark is still over the manager. Despite an acceptable position in the league, there were major issues with the performances last season. There remain issues with the squad but he undoubtedly has more to work with this season – this team should be capable of causing more problems. However, things will likely have to improve just to be on a par with last season, so it could still be a struggle.

Credit to Statsbomb and FBREF for data.

Bruce’s Back-Foot Football

Written by John-Paul Quinn – @AttackingCB

Steve Bruce’s Newcastle remain in a relatively comfortable league position, despite not looking like a very good football team. I wrote last month about how they appear to have regressed in every area (bar points) from last season. Since then, they have beaten Chelsea with a last-minute winner and scored 2 goals in the 94th and 95th minutes to salvage a point against Everton, after clearly being second-best in both games.

The expected goals numbers continue to move in the wrong direction, with the xG against figure now significantly higher than at any point in the last 2 years. Much of the criticism of Bruce has been aimed at the attacking side, which is clearly an issue – only Crystal Palace have scored fewer than Newcastle’s 24 goals – but they are far from solid defensively either, as demonstrated by a 4-0 defeat at the Emirates on Sunday. Only Norwich have a worse goal difference.

New xG Trend 1920

There has been an interesting conversation recently about Liverpool’s xG, as most models seem to underrate them, suggesting Man City might still be the better team despite Liverpool’s 22 point lead at the top of the table. One explanation for their over-performance can be demonstrated by a post-shot xG model which suggests that the opposition have been taking worse shots (which may or may not be down to something Liverpool are consciously doing). However, it is worth pointing out that on FBREF’s post-shot model, on the defensive side at least, Newcastle’s numbers get worse, not better.

What else is notable is that Newcastle have only ‘won’ on xG ONCE this season – at home to Bournemouth (which they actually won 2-1).

New xG per game 1920

This is where the ridiculously low expected points figure comes from, when looking at the ‘most likely result’, Newcastle would only pick up 3 points once. If you were to use an ‘average points’ method it would be kinder, but still not pleasant viewing.

PL xPts Feb20

Taken from experimental361.com – produced by Ben Mayhew.

Last season Newcastle ‘won’ 13 of 38 games on xG, which is closer to what you would expect for a team that finished 13th and actually won 12 games. So if Bruce is largely sticking to the same style and system (a defensive 5-4-1) and has much the same players (certainly on the defensive side), why such a contrast in output?

The possession stats start to give an indication of what has changed:

New Poss by Game 1819

Last season, Newcastle averaged 40.1% possession, which is pretty low, but this season the average has dropped significantly to 34.7%. They have only had more possession than their opposition once this season – against Burnley, who average the second-lowest possession in the league. Last season they did it 10 times.

New Poss by Game 1920

There’s certainly a consistency to it – there may be an argument that if that’s the way you want to play and you’re good at it, why alter it?

Next, we look at the pressing stats. PPDA stands for passes per defensive action (in the opposition half) and is a measure of pressing – a lower number indicating a more pressing team.

New PPDA by Game 181920

Here we see a dramatic increase in the average (from 14.7 to 24.7), and we start to see some really high numbers. Newcastle were one of the least-pressing teams in the league last season but this season they are THE least-pressing BY FAR. Under Rafa, we saw some very deep defending against the likes of Man City and Liverpool (indeed he was often criticised for it) but there were also times where they would play more pro-actively against weaker opposition. The current team doesn’t seem capable of that.

PL Defensive Pressure Feb20

Source: Statsbomb

This lack of pressing means you are constantly defending in and around your own box – only Norwich and Aston Villa are comparable in how deep they defend. It invites pressure but also makes it harder to transition into attack and harder to sustain those attacks. If you can win the ball higher up the pitch, you have more chance of a dangerous attack, rather than starting from the edge of your own box. Something Liverpool and Man City have had great success with – not just winning the ball back but winning it *in dangerous positions*. Think Sean Longstaff nicking the ball off Fernandinho in his own box and winning a penalty at St. James’ Park (and that was against Man City). That doesn’t seem to happen this season.

From open play there’s a reliance on Saint-Maximin or Almirón to dribble their way into a dangerous position but it’s often an individual effort rather than a collective – they and Joelinton are too often isolated. The team’s lack of ability to progress the ball into dangerous positions is reflected by the fact they play fewer passes into the box than any other team in the league.

PL PPA 1920

The other issue is what happens when Newcastle go behind, when they need to chase the game, what is the plan? Bruce has repeatedly said that every time the team opens up a bit, they start to look ragged defensively (and he’s not wrong).

There were concerns when Bruce was appointed that he would move away from the solid base that Benítez had built. There was talk of playing a more ‘font-foot’ style but in fact he has done the opposite. This is a more extreme version of Rafa’s defensive model and, as is increasingly clear, an inferior version. Bruce has also said that the players don’t know how to play any other way or that they aren’t capable, that he is basically stuck with this system and tactical set-up for now, but the numbers show that they were capable of a different approach last season.

Newcastle United – Mid-Season Statistical Summary

Written by John-Paul Quinn – @AttackingCB

So we’re just past the halfway point in the season, having played 21 league games, and Newcastle sit in 13th place with 25 points. 5 points above the relegation zone and the same distance from Tottenham in 6th, this would seem like a pretty comfortable position – better than some feared at least, after the departure of Rafa Benítez and the appointment of Steve Bruce as his successor.

New Ssn Comparison

In terms of points per game, the team is marginally ahead of the performance in the last 2 seasons – the results are basically fine. But in every other measure, the team appears to have regressed. They are scoring fewer goals, conceding more and the ‘expected’ numbers (xG is a measure of chance quality) back that up (in fact they suggest things are even worse). These sorts of numbers are going to catch up with you eventually and perhaps we’re starting to see that with the last 3 results (losses to Man United, Everton and Leicester).

PLxG1920

The long-term trend since the summer is worrying:

New xG Trend 1920

Newcastle are consistently getting beat on xG this season. Some good fortune and good goalkeeping has meant that they’ve won some games they didn’t really deserve to. In particular, against Sheffield United, Southampton and Palace, Newcastle were really poor for large spells of those games but managed to come out with 3 points.

New xG per game 1920

The possession figure has also dropped significantly. Newcastle were not a possession-based team under Rafa but now comfortably have the lowest possession figures in the league (more than 4% lower than next-lowest Burnley). The pass % has not dropped however, suggesting this is more an issue of winning the ball back than keeping it. Indeed, Understat has Newcastle on the highest PPDA in the league BY FAR and with a much higher figure than previous years. PPDA stands for passes per defensive action (in the opposition half) and is a measure of pressing – a lower number indicating a more pressing team. No other team is sitting off the opposition to such an extent.

PPDA PL 1920

Is this necessarily a bad thing? No, but the other figures would suggest it isn’t having a positive effect and considering Benítez was accused at times of being overly cautious, this appears to be an even more negative, one-dimensional version of his system.

In terms of the attack, Bruce has tinkered with the system and personnel but so far hasn’t found a winning formula – the forwards have 3 league goals between them. Almirón, despite his long run without a goal or assist, has been the best at getting into goalscoring positions (enough to score 4 goals) but a combination of poor finishing and some bad luck mean he has just 1 goal. His creative output should be a concern though.

New Squad xG xA 1920

Similarly with Joelinton, his expected numbers are better than his actual output but you want more from a £40m signing. Doubts about him are increasing, although you wonder whether any striker would struggle in this team. Carroll is offering something but he isn’t scoring either and Saint-Maximin is clearly dangerous but his end product is inconsistent – no one is reliably going to score or create goals regularly. So far the defenders have bailed the team out, with 10 of Newcastle’s 20 goals. Jonjo Shelvey, not known for his goalscoring, has another 5. This won’t continue forever.

Of course this doesn’t fall completely on the manager. The other significant changes over the summer were the loss of Ayoze Pérez and Salomon Rondón (23 goals between them last season), effectively replaced by Saint-Maximin and Joelinton. The front 3 cost a combined £80m but have just 1 goal each… this was always a concern and the recruitment needs to be questioned.

So if the team is getting worse in pretty much every way, is relegation inevitable? Well, 5 points is still a pretty good cushion at this stage and there are plenty of other teams struggling. Norwich look likely to go down now, while Villa, Watford, Bournemouth and West Ham all have issues. Newcastle need another 15 points from 17 games to reach the magic 40 points, which even for a bad team is achievable (and they may not need that many). They are definitely still in the fight but have about a 75% chance of staying up.

The January transfer window is now open and Newcastle have tended to strengthen in January, although they never seem to be organised about it. They are likely to look at loan options and Bruce has made it clear he wants a forward.

The manager has clearly recognised the issues going forward but hasn’t been able to solve them so far and hasn’t maintained the defensive solidity from the last 2 seasons either. We saw improvements in the second half of the season in both cases under Rafa and there needs to be similar improvements this time around or Newcastle could be in real danger. Whatever happens, the club is certainly not moving forwards and again finds itself worrying about relegation.

 
Data from FBREF and Understat.

Why Brighton’s goals aren’t reflecting Potter in the ways you might expect

Written by @AlbionAnalytics

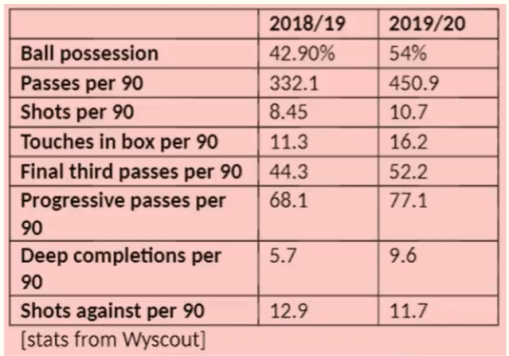
Albion’s average number of passes has spiked from 378 per game last season to 492 per game this season, with average passes per possession naturally following suit: up to 4.85 from 3.69 (Wyscout). In Tifo Football’s video breaking down Potter’s tactics, they highlight numbers which fully support this idea that Brighton are ‘keeping the ball more, passing more’. So well is this reflected in the numbers in-fact, that our averages for ball possession, passes per game, final third passes per game, progressive passes per game and deep completions per game have all increased from last season. Perhaps our change in passing approach is best demonstrated by the decrease in our long ball average per game, despite having much more possession.

Brighton Poss Stats

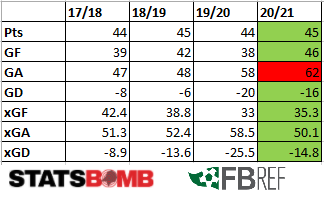
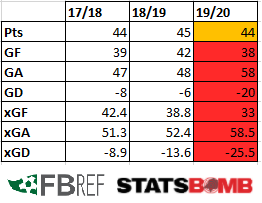
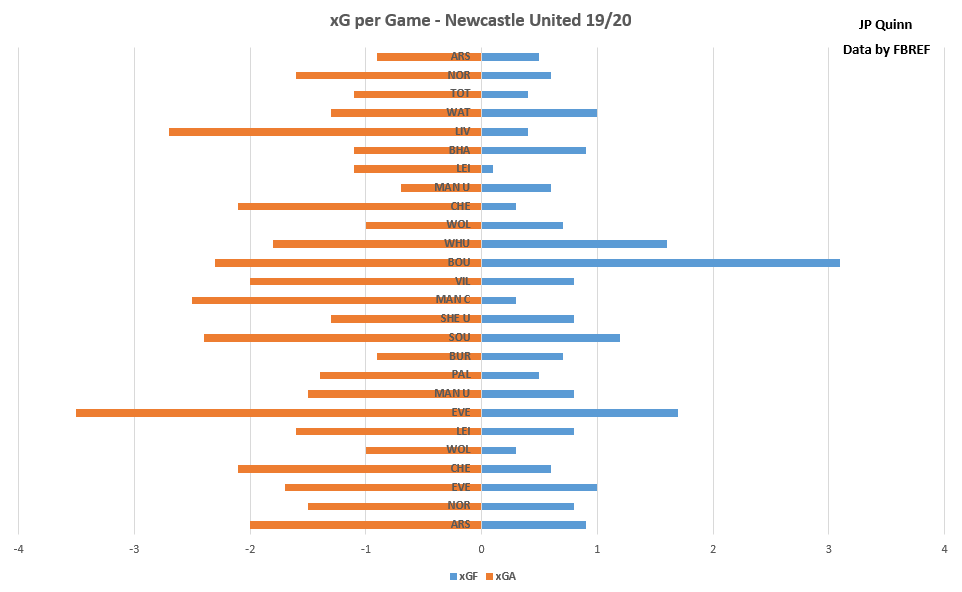
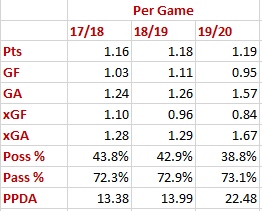
Newcastle away is the exemplar fixture for demonstrating the stark contrast in passing approach, with the graphic below showing our performance in multiple passing based metrics from last season (18/19) and this season (19/20):

Brighton Stats Newcastle

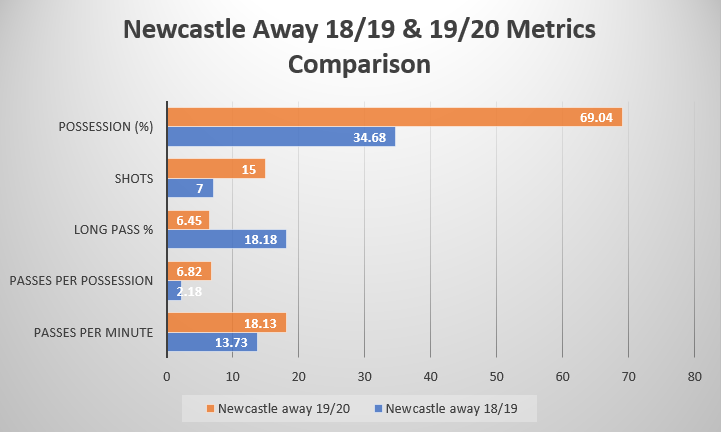
Taking this Wyscout data from the two fixtures, visually the differences in Brighton’s approach are obvious. Last season we set up pragmatically, ceding control of the ball to hit Newcastle on the counter-attack; this season we did the converse: attempted over 680 passes – completing over 620 – and dominating with almost 70% possession, figures which were over double what we recorded in the same fixture last season. Nevertheless, the critical difference between the two fixtures was the score-line: we drew 0-0 this season and last season our pragmatic approach proved more fruitful, as we ran out 1-0 winners on Tyneside.

This article’s central focus is to draw attention to how and why our goals this season don’t reflect such a change in passing approach. In Chris Anderson and David Sully’s book The Numbers Game, they focus on a statistically supported argument that the majority of goals occur from sequences involving very few passes – just 2 of every 9 goals scored are from passing moves with 4+ passes. Anderson and Sully’s observation that two-thirds of goals are scored from open play is mirrored perfectly by our goalscoring – up to and including game-week 12: 10 of our 15 goals thus far have been from open play.

The visual below shows the number of passes involved in each of the 10 open-play ‘possessions’ we have had in the Premier League this season which have led to a goal:

Brighton PPG

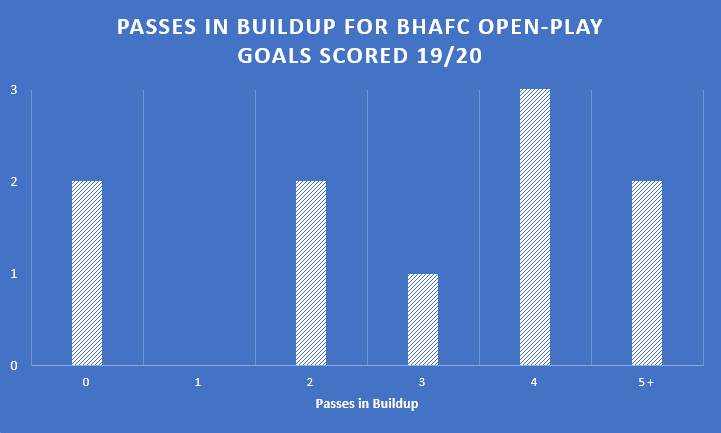
8 out of 10 of our open play goals came from build-ups of 4 or fewer passes; surprisingly, given the averages mentioned for passes per possession, just 2 of our 10 open play goals were from moves with 5+ passes in the build-up.

Naturally, set-piece goals will skew the distribution towards fewer passes, as goals can be scored or assisted directly from these scenarios, often resulting in goals scored with 0 or just 1 pass from them. From the 5 set-piece situations we’ve scored from, 3 involved 1 pass (Webster vs Villa; Duffy vs Norwich; Dunk vs Man United) and 2 were direct finishes – 0 passes – (Gross vs Everton; Maupay vs Everton).

In order to maximise the sample size, the own goals from Doucoure (Watford) and Digne (Everton) have been treated as if they were finishes by a Brighton player – stats providers often consider own goals to not be assist-able as the passes are technically incomplete, thus any passes in the build-up to it are additionally excluded. In this case though, the finish itself is irrelevant as it is the build-up play which is of interest, hence their inclusion.

Despite us averaging over 4 passes per possession across Premier League games this season, our average passes per possession for open play goals is only 3.5, around 1 pass per possession fewer than what we are averaging each game.

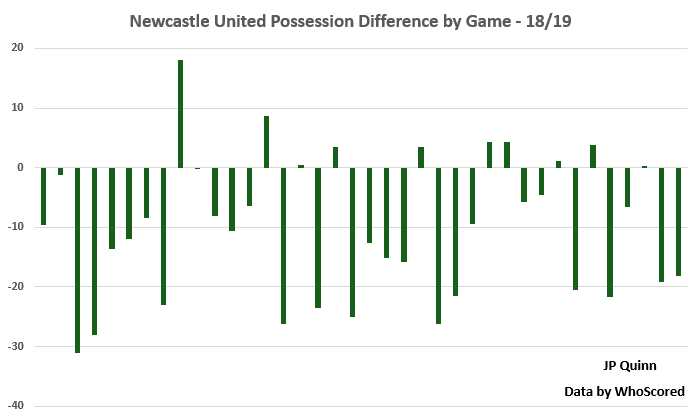
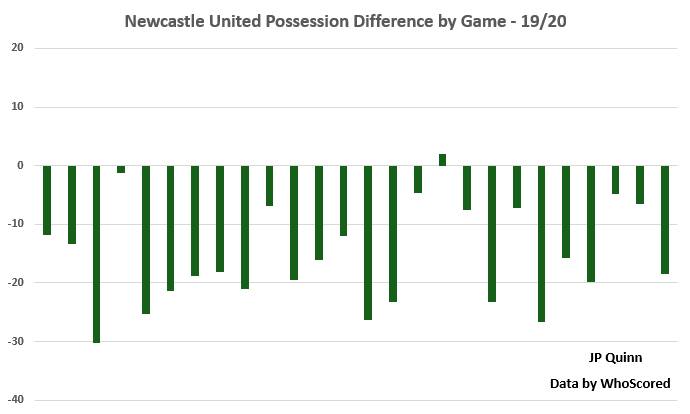
Referring to the aforementioned Newcastle fixture, we averaged 6.82 passes per possession in that game – a season high. That average is almost double the number of passes we typically make in possessions we score from in open play! Compared to our opening 12 games last season, we’re averaging more passes per possession:

Brighton PPG GW

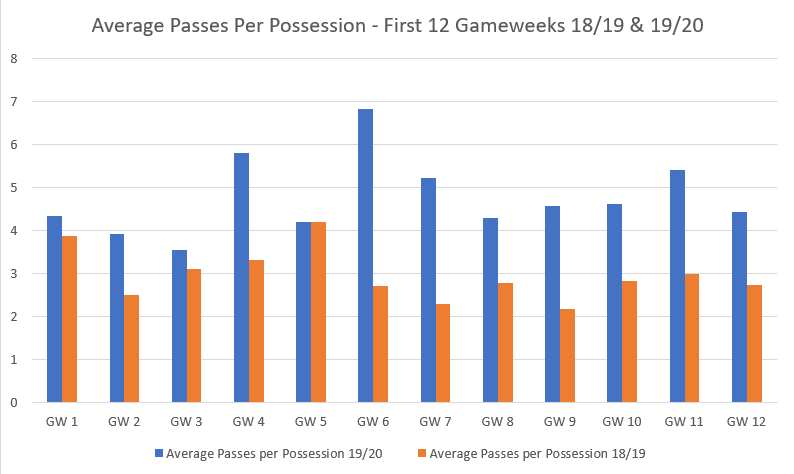
On just 2 occasions this season – gameweek 2 (by 0.08) and gameweek 3 (played most of the game with 10 men) – have we averaged less than 4 passes per possession. In comparison, last season we averaged less than 4 in 11 of the opening 12 gameweeks. In fact, whilst winning 3 on the bounce in October 2018, we recorded 2.77, 2.18 and 2.83 passes per possession respectively.

With such clear differentiation in passing approaches, crucially the amount of passes we’re making each time we have possession, you’d naturally expect our goals to mirror this, right? Wrong. Just 2 of our goals have had over 4 passes in their sequence, despite our average being above this for each possession. 7 passes in the build-up for Digne’s own goal and 9 passes for Maupay’s goal at Watford are the two outliers as actual ‘Potterball’ goals.

The more passes made in a sequence not only means more opportunity for breakdown to occur – as every pass needs to be accurate – but also may give the opportunity for the opposition to structure themselves better defensively, making them harder to breakdown. In addition, as pass frequency increases the average pass distance is expected to decrease – a higher passing tempo is typically met by a shorter passing approach. Shorter, more intricate passes are used to break down teams by playing through a press, rather than playing around it or over it with a long ball. Our lone example of this approach resulting in a goal is Digne’s own goal, and the defensive structure of Everton was to a large extent compromised, given we actually counter-attacked them, albeit from our own penalty area.

What is crucial to understand is that as we are purely looking at goals, excluding own goals, all passing moves have been successful ones. Therefore, long passes which are successful are significantly more likely – overall – to generate goals than shorter passes, as they are covering a longer distance and therefore placing you closer to the opposition’s goal. There’s a system used to determine the value of a pass in relation to what extent it creates a goalscoring opportunity – PassScore. Whilst this article won’t go into detail in applying this to our passing moves, there’s an excellent article explaining the role of the metric.

The ‘Packing’ metric can be applied in this scenario: this looks at the value of a pass based on how many opposition players it bypasses – to what extent the pass is ‘line-breaking’. Data from Impect on the 15th October had us 3rd in the league for ‘bypassed opponents’, with a total of 335, which only Chelsea and Man City had bettered; yes, up to that point we’d bypassed more opponents than Liverpool – albeit by one. Make of that what you will.

Brighton Packing

Dunk’s 2 assists this season have both been long passes; 8 opponents were bypassed with his assist for Maupay at Watford and all 10 Spurs opponents were bypassed in assisting Aaron Connolly for his second. When you consider that so many opponents can be bypassed with a single pass, which creates dangerous goalscoring opportunities, it is perhaps no surprise to see fewer passing moves make up most of the goals. Even with the 9-pass move that led to Maupay’s debut goal, 8 of the 9 passes occurred in our defensive third, as we switched play from right to left, and the last of the 9 passes was of course that long pass from Dunk which bypassed 8 opponents.

Of course making four or more consecutive passes doesn’t eliminate the chance of you scoring altogether, though typically the more passes you make decreases the likelihood of scoring. If you like, passes per possession and goalscoring likelihood almost appear negatively correlated. Therefore, this surely means ‘Potterball’ is ultimately purposeless? Not at all. Maupay’s goal at Watford may be a perfect example of how high passing sequences may lead to goals in manners that aren’t expected. Most would consider a high passing move leading to a goal to manifest as a Barcelona or Spain ‘tiki-taka’ move overflowing with 1-touch passing and flicks. However, at Watford we were able to use a short passing approach to shift the Watford press, to create central space for Dunk to break the forward line by carrying the ball, then break the midfield and defensive lines to find Maupay for his first of 4 goals this season.

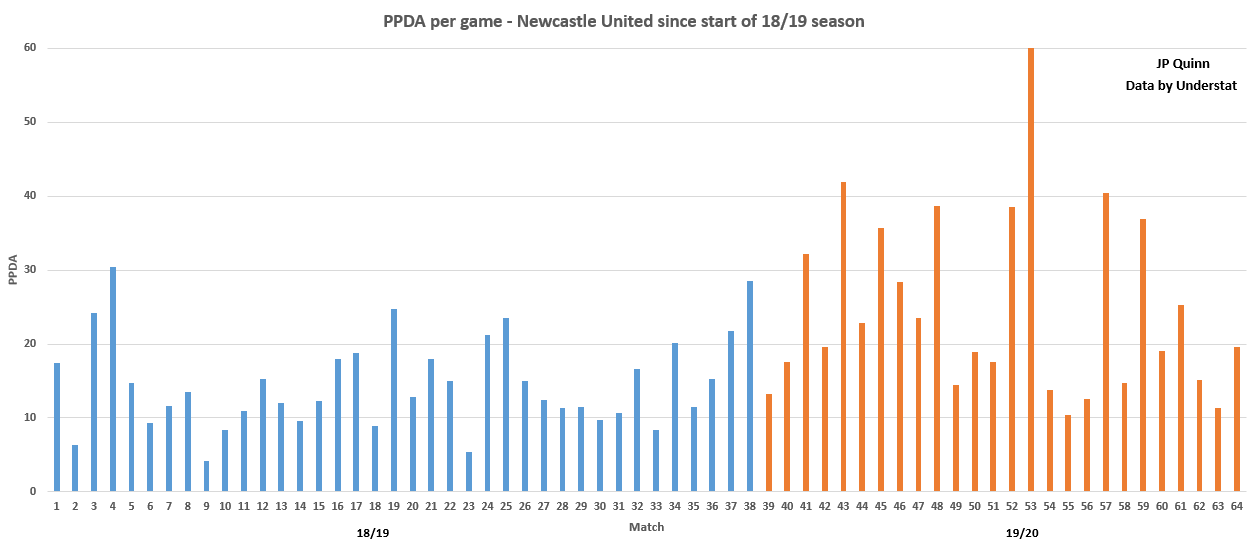
Ultimately, not all goals require the same – or a lot of – passes to score; take the Doucoure own goal at Watford. Dale Stephens intercepted the ball on the halfway line, meaning when we countered, we only had half the pitch to cover; therefore fewer passes are required than if the sequence’s point of origin was from our own penalty area, as the distance between us and the opposition’s goal is shorter. In fact, only 4 of the 10 open play goals we’ve scored have involved Ryan and started from our own box: Maupay vs Watford, Maupay vs Burnley, Connolly (2nd goal) vs Spurs, Digne OG vs Everton. The fact that the majority of open play goals have started in the opposition half may be reflective of our increased pressing rate – another key ‘Potterball’ component – as the number of passes Brighton are allowing opponents before a defensive action occurs (PPDA) has dropped from 13.82 to 11.11 (Wyscout).

The most interesting statistic about these 4 goals? Half of them had 4 or fewer passes in the build-up. Accompanying the aforementioned long ball is the role of the ball carrying CB in reducing passes per possession leading to a goal – particularly Adam Webster. He carried the ball for approximately 50 yards for Maupay’s goal against Burnley, with progressive centre-backs a key cog in the ‘Potterball’ wheel. This shows that not all low passing moves mean long balls, there will be occasions where ground is covered by players running with the ball. Webster is particularly outstanding from a ‘Packing’ perspective: As of the 16th October he had bypassed 76 opponents with the ball, only Aymeric Laporte of City had more with 86.

Brighton Packing Webster

It is difficult to draw concrete conclusions though, as ultimately the season is only 12 games old. There is a possibility that we have simply failed to convert many high passing moves and it may be that we will see the average rise in the remaining 26 games but up to now the occasional directness in Albion’s play has been effective.